When you enter the concole, you can see the "Analytics" section.

Step 1: Choose to view analytics data for yesterday or today

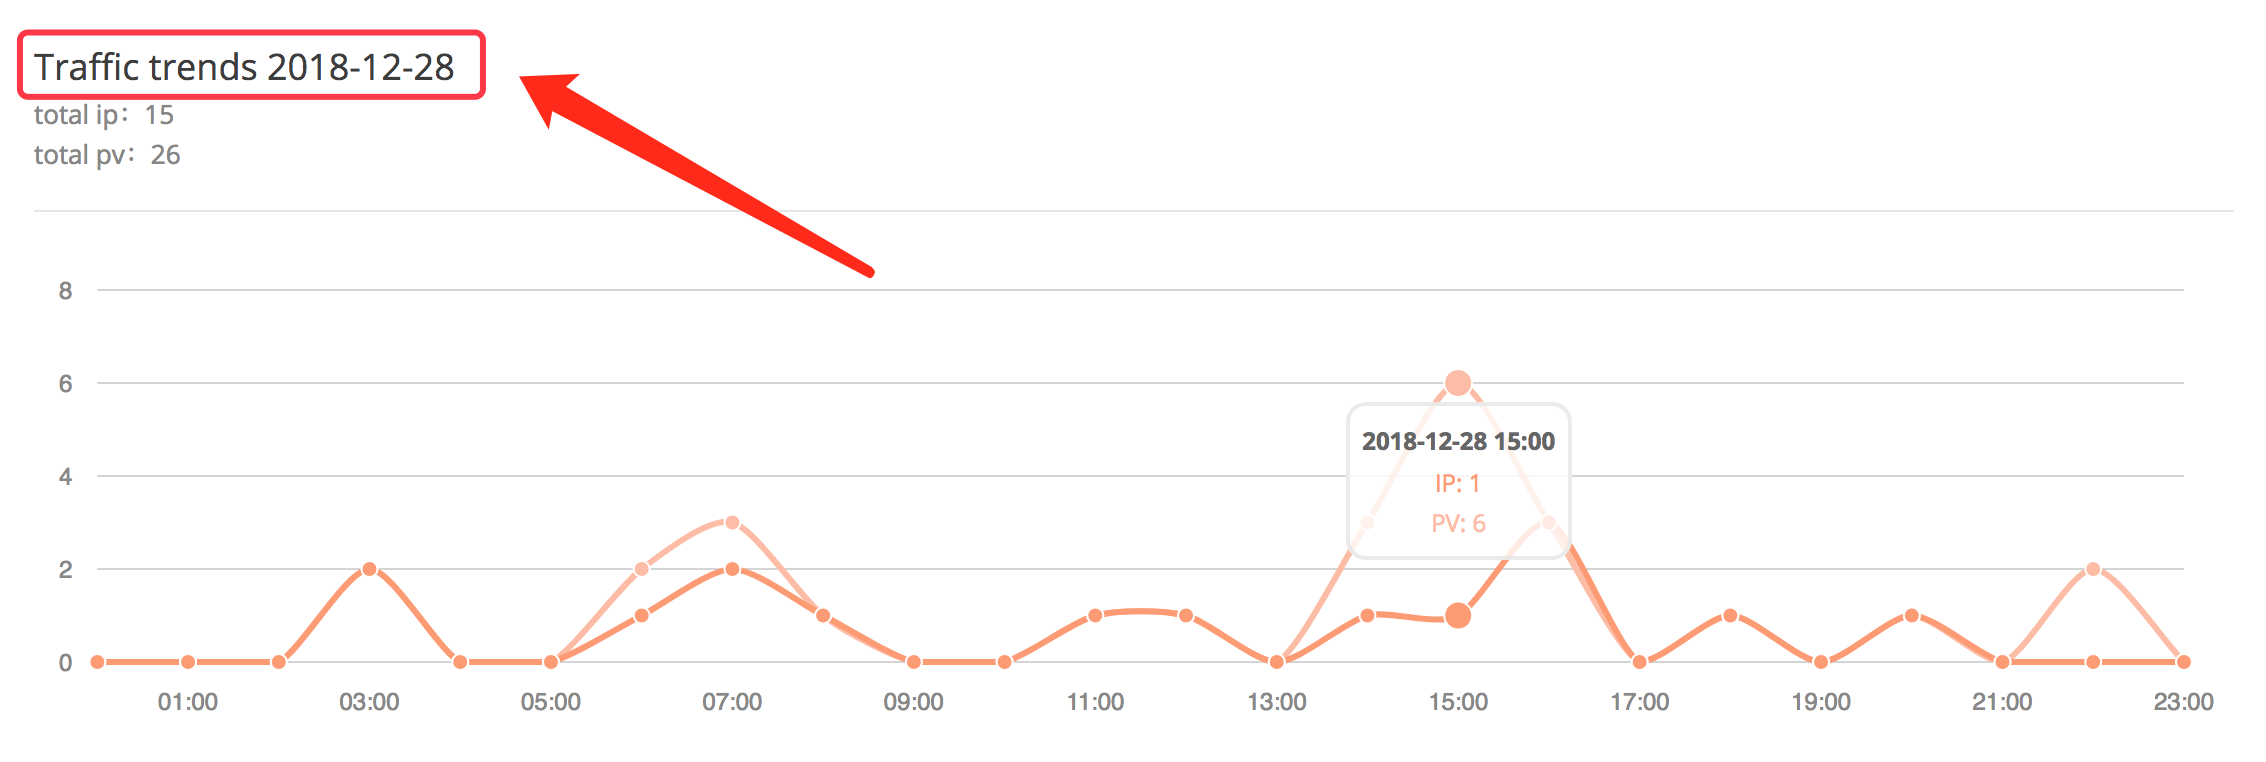
Step 2: By viewing "Traffic Trends+Date", you can see the number of IPs and PVs per hour of the day.
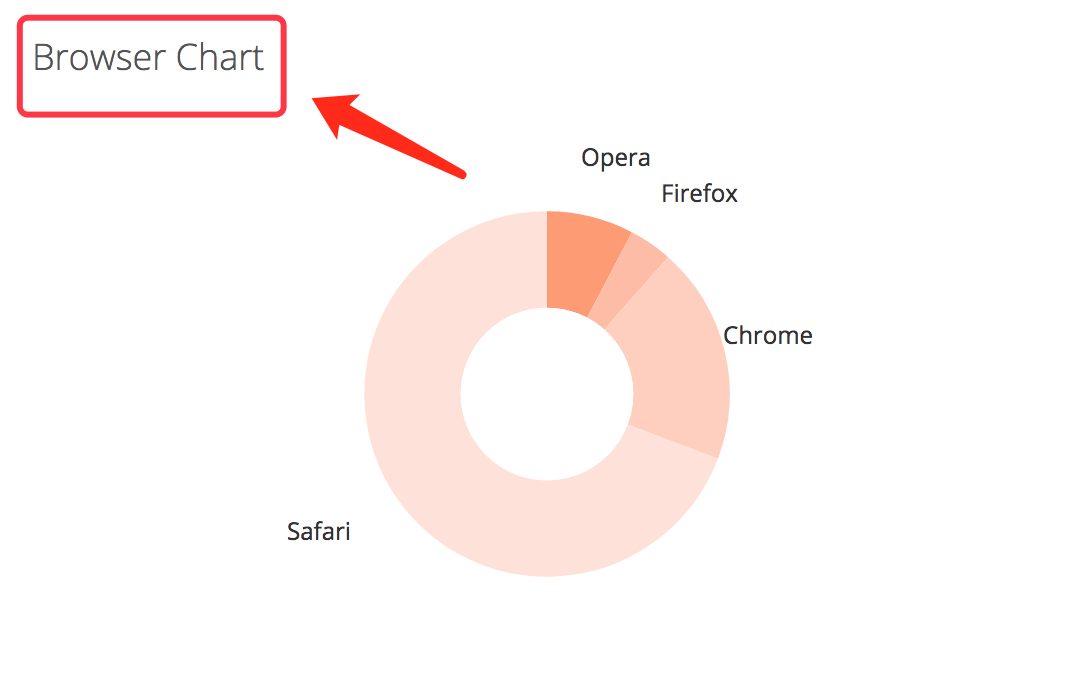
Step 3: By viewing the "Browser Chart", you can view the browser's access to the current day.
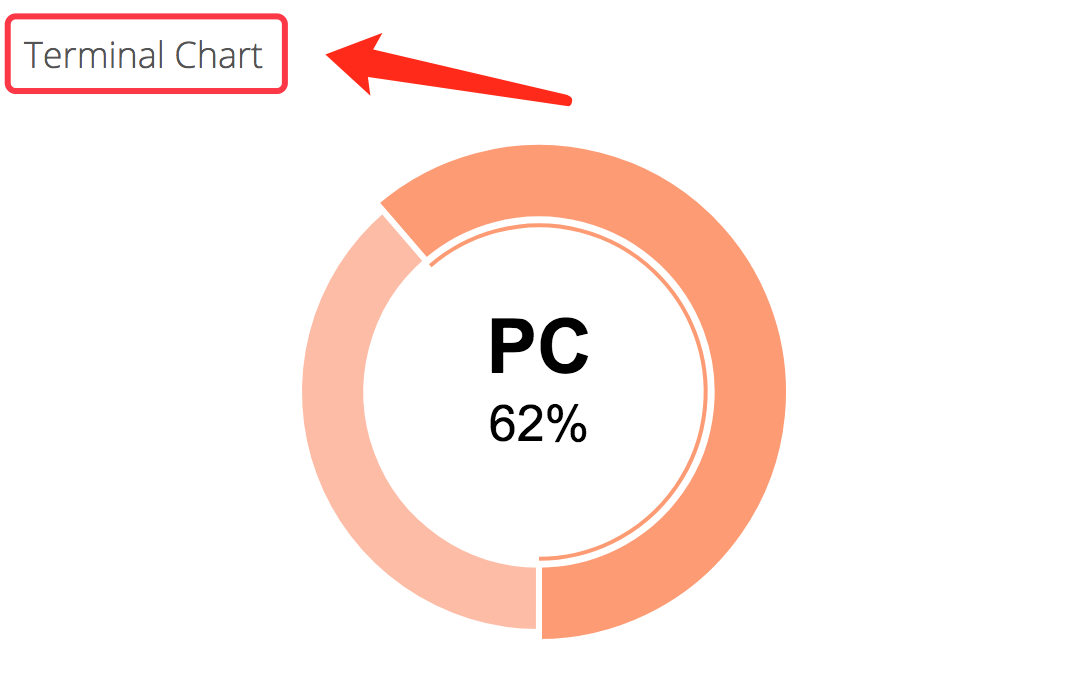
Step 4: By viewing the “Terminal Chart”, you can see the percentage of website visits using PCs and mobile phones
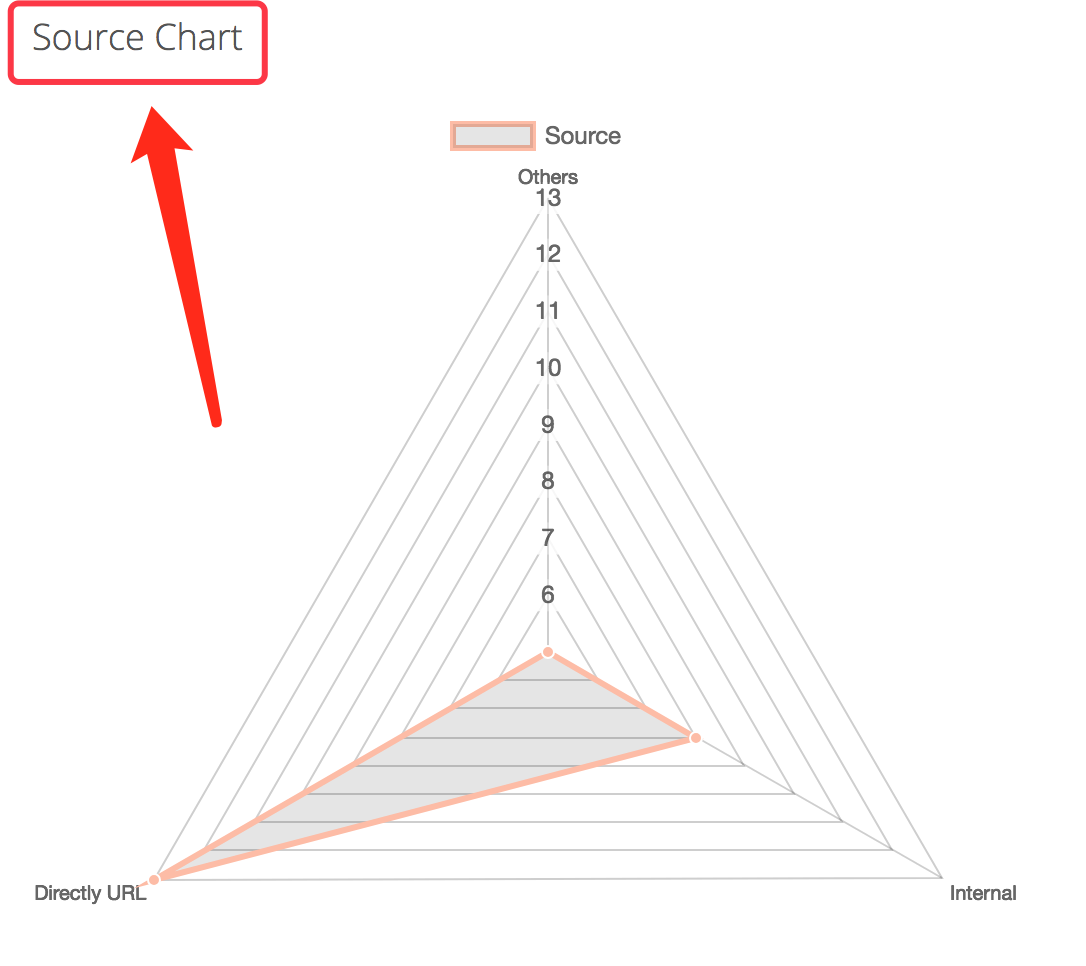
Step 5: By viewing the "Refer domain", you can view the relevant data of the source website.
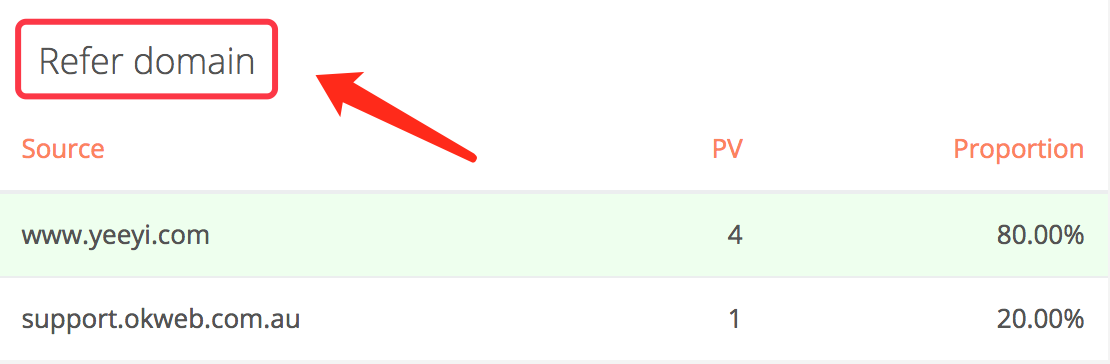
Step 6: You can use this Chart to learn more about the source data.